Cross-Domain Circuit Analysis of
Factual Knowledge Retrieval in LLMs

Mechanistic Interpretability  ·  April 2026

TLDR: Across 60 attribution graphs spanning chemistry, geography, and history on Gemma-2-2B and Qwen3-4B, model architecture explains roughly 14× more variance in circuit structure than knowledge domain. We introduce traceback graphing, identify a "bottleneck penalty" linking bottleneck-layer activation to lower confidence, and show via 80 steering experiments that pathway topology, cross-circuit frequency, and text-level steerability decouple into a three-tier dissociation.


Abstract

We characterize the cross-domain organization of factual knowledge circuits in two large language models by analyzing attribution graphs for 60 prompts spanning three knowledge domains: chemical symbol lookup (10 prompts), world capital retrieval (10 prompts), and historical date recall (10 prompts), generated for both Gemma-2-2B and Qwen3-4B via the Neuronpedia API. We introduce traceback graphing, a priority-guided backward search (best-first search) with geometric score decay (factor 0.8) that traces critical paths from output predictions back to input features and identifies bottleneck features where 60% or more of paths converge.

Per-layer activation profiling reveals that within-model profile similarity is 0.978 across knowledge domains while between-model similarity is only 0.696. We term this pattern "architecture dominance," the observation that within-model layer activation profile similarity clusters roughly 14× more tightly than between-model similarity, with knowledge domain modulating the profile by less than 2%. The two architectures use complementary activation accumulation strategies, Gemma front-loading 54% of activation magnitude into layers 0–12 while Qwen back-loads with only 31% in the corresponding first half, yet both achieve comparable factual recall accuracy. Within each architecture we identify universal bottleneck features (features serving as bottlenecks across all three knowledge domains): six in Gemma and 15 in Qwen, with zero overlap between architectures. Their dominant categories (code, language) suggest a routing-infrastructure function rather than a knowledge-storage one.

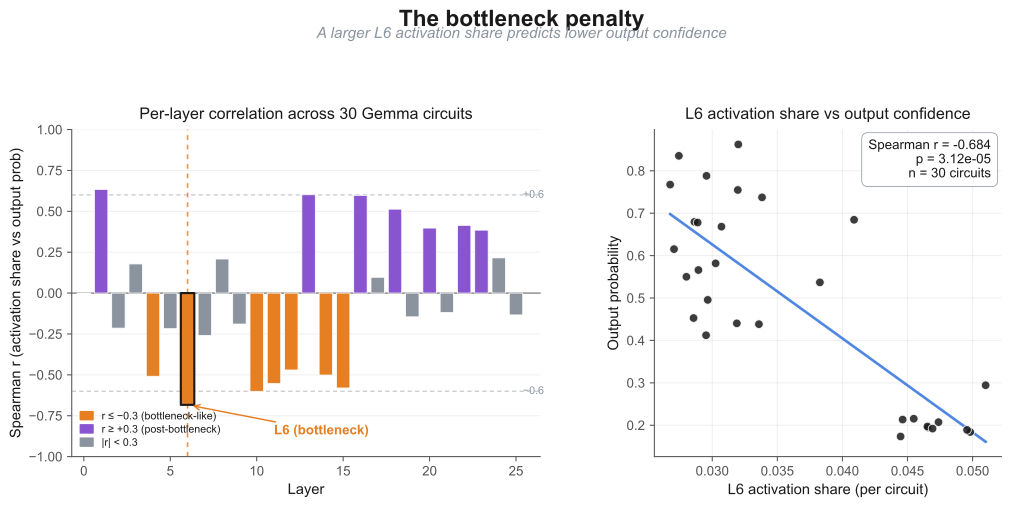
In Gemma, activation magnitude at the bottleneck layer L6 negatively correlates with output confidence (Spearman r = −0.684, Bonferroni-significant), while activation at post-bottleneck layers L13 and L16 positively predicts confidence (r ≈ +0.60). We term this pattern the "bottleneck penalty," heavier activation concentration at the bottleneck layer predicting lower downstream confidence, and interpret it through information bottleneck theory (Tishby & Zaslavsky, 2015) as evidence consistent with over-compression at intermediate layers reducing the information available for downstream evidence accumulation. Causal validation via 80 steering experiments reveals a three-tier dissociation: essential-pathway topology predicts distributional perturbation strength (mean KL = 1.448), cross-circuit frequency does not predict causal influence, and text-level output changes are governed by output entropy rather than feature-selection criteria. Circuit redundancy (94.1% of nodes are non-essential) absorbs even strong tier-1 perturbations before they reach the output layer.


Key Findings

  • Architecture dominance. Across 60 circuits, the architecture gap in layer activation profile similarity is roughly 14× the domain gap. Gemma concentrates 54% of total activation magnitude in early layers (front-loaded); Qwen places only 31% there (back-loaded). Both produce comparable factual recall. [Jump to §3.2 →]
  • Universal bottleneck features. Six Gemma and 15 Qwen features participate in circuits across chemistry, geography, AND history. Zero cross-architecture overlap. Function: routing infrastructure, not knowledge stores. [Jump to §3.3 →]
  • The bottleneck penalty. More activation at Gemma's bottleneck layer L6 predicts worse output confidence (r = −0.684, Bonferroni-significant). Counter-intuitive correlation consistent with information bottleneck theory. [Jump to §3.5 →]
  • The three-tier dissociation. 80 steering experiments reveal that pathway topology, cross-circuit frequency, and text-level behavior each measure different things. Essential-pathway features perturb distributions strongest (KL = 1.448) but 94% circuit redundancy absorbs them. [Jump to §3.7 →]

1. Introduction

1.1 Motivation

Large language models encode vast factual knowledge, yet how this knowledge is organized at the circuit level remains poorly understood. When a model predicts that the chemical symbol for gold is "Au" or that the capital of Japan is "Tokyo," which internal features are responsible?

A central question is whether different knowledge types (symbolic mappings, geographic relations, temporal facts) use separate specialised circuits or share common computational infrastructure. Both possibilities are consistent with the existing mechanistic-interpretability literature, and the question has been studied only piecemeal.

The answer matters for model editing and targeted intervention. If factual knowledge is organized by domain, interventions must be domain-specific. If circuits share universal bottleneck features, a small number of features could provide efficient intervention points across multiple knowledge types.

1.2 Research Questions

  1. Within-domain convergence. Do prompts querying the same type of knowledge (e.g., chemical symbols) share circuit architecture?
  2. Cross-domain divergence. Do different knowledge types use different circuit features or layer depths?
  3. Universal bottlenecks. Are there features that participate in circuits across all knowledge domains?
  4. Architecture vs. domain. Is circuit structure more determined by model architecture or by the type of knowledge being retrieved?

1.3 Contributions

We present six contributions:

  1. Systematic cross-domain circuit analysis. The first large-scale comparison of attribution circuits across three knowledge domains on two model architectures (60 circuits total), with statistical validation via permutation tests (p < 0.0001).
  2. Architecture-dominance finding. Demonstration that bottleneck depth is determined by model architecture, not knowledge domain. Gemma consistently uses early bottlenecks (L5–7) and Qwen uses late bottlenecks (L22–25) regardless of whether the task involves chemistry, geography, or history. Cross-model Mann–Whitney tests confirm 13/16 structural metrics differ significantly (Bonferroni-corrected).
  3. Universal bottleneck identification. Discovery of 6 universal bottleneck features in Gemma and 15 in Qwen that participate in circuits across all three knowledge domains, with zero overlap between architectures.
  4. Output–path convergence dissociation. Finding that same-domain circuits share output features far more than intermediate features (up to 4.4× ratio), revealing convergent predictions from divergent internal processing.
  5. Confidence regression model. A three-predictor regression model explains 49% of Gemma prediction-confidence variance using total activation magnitude, edge weight kurtosis, and circuit size (F(3,26) = 8.30, p < 0.001). Bottleneck position and convergence do not significantly predict confidence, constraining "bottleneck quality" explanations.
  6. Three-tier causal dissociation. 80 steering experiments reveal that essential-pathway features produce strong distributional perturbations (mean KL = 1.448) but neither pathway topology nor cross-circuit frequency predicts text-level output changes: circuit redundancy absorbs perturbations, and output determinism governs steering susceptibility.

2. Methodology

Attribution graphs were generated via the Neuronpedia /api/graph/generate endpoint with maxFeatureNodes=3000, desiredLogitProb=0.95, nodeThreshold=0.8, edgeThreshold=0.85. Graphs typically contain 1,000–1,500 nodes and 40,000–80,000 edges. Our core analytical method is a priority-guided backward (best-first) search from the top-K output nodes that traces critical paths through intermediate layers and identifies bottleneck features where 60%+ of paths converge.

"Capital of PROMPT Japan is" ATTRIBUTION GRAPH ~1,200 nodes ~60K edges Transcoder features × layers Neuronpedia API TRACEBACK SEARCH Backward search decay = 0.8 Top-K paths depth ≤ 20 B BOTTLENECKS ≥60% score(n_p) = activation(n_p) × weight(n_p → n) × score(n)^0.8

Figure 1. Traceback graphing pipeline. Starting from the highest-contributing output nodes, the algorithm walks backward through the attribution graph, scoring predecessors by activation × edge weight × decayed downstream score. Geometric decay (factor 0.8) prevents score overflow across 20+ layers while preserving relative path ranking.

Models & Transcoders

  • Gemma-2-2B (Google): 26 layers, ~2B parameters, gemmascope-transcoder-16k (Gemma Scope transcoder, 16,384 features per layer)
  • Qwen3-4B (Alibaba): 36 layers, ~4B parameters, transcoder-hp (Neuronpedia-hosted transcoder)

Prompt Design

Three knowledge domains × 10 prompts each, with template-controlled phrasing:

DomainTemplateExamples
Chemistry"The chemical symbol for [element] is"gold→Au, iron→Fe, mercury→Hg
Geography"The capital of [country] is"France→Paris, Japan→Tokyo
HistoryVarious event-date formatsWWII ended→1945, Titanic sank→1912

3. Results

Seven findings, in narrative order: from architecture-level structure (§3.1–§3.2) to specific feature behavior (§3.3–§3.4) to mechanistic interpretation (§3.5–§3.6) to causal validation (§3.7–§3.8).

3.1 Within-domain convergence

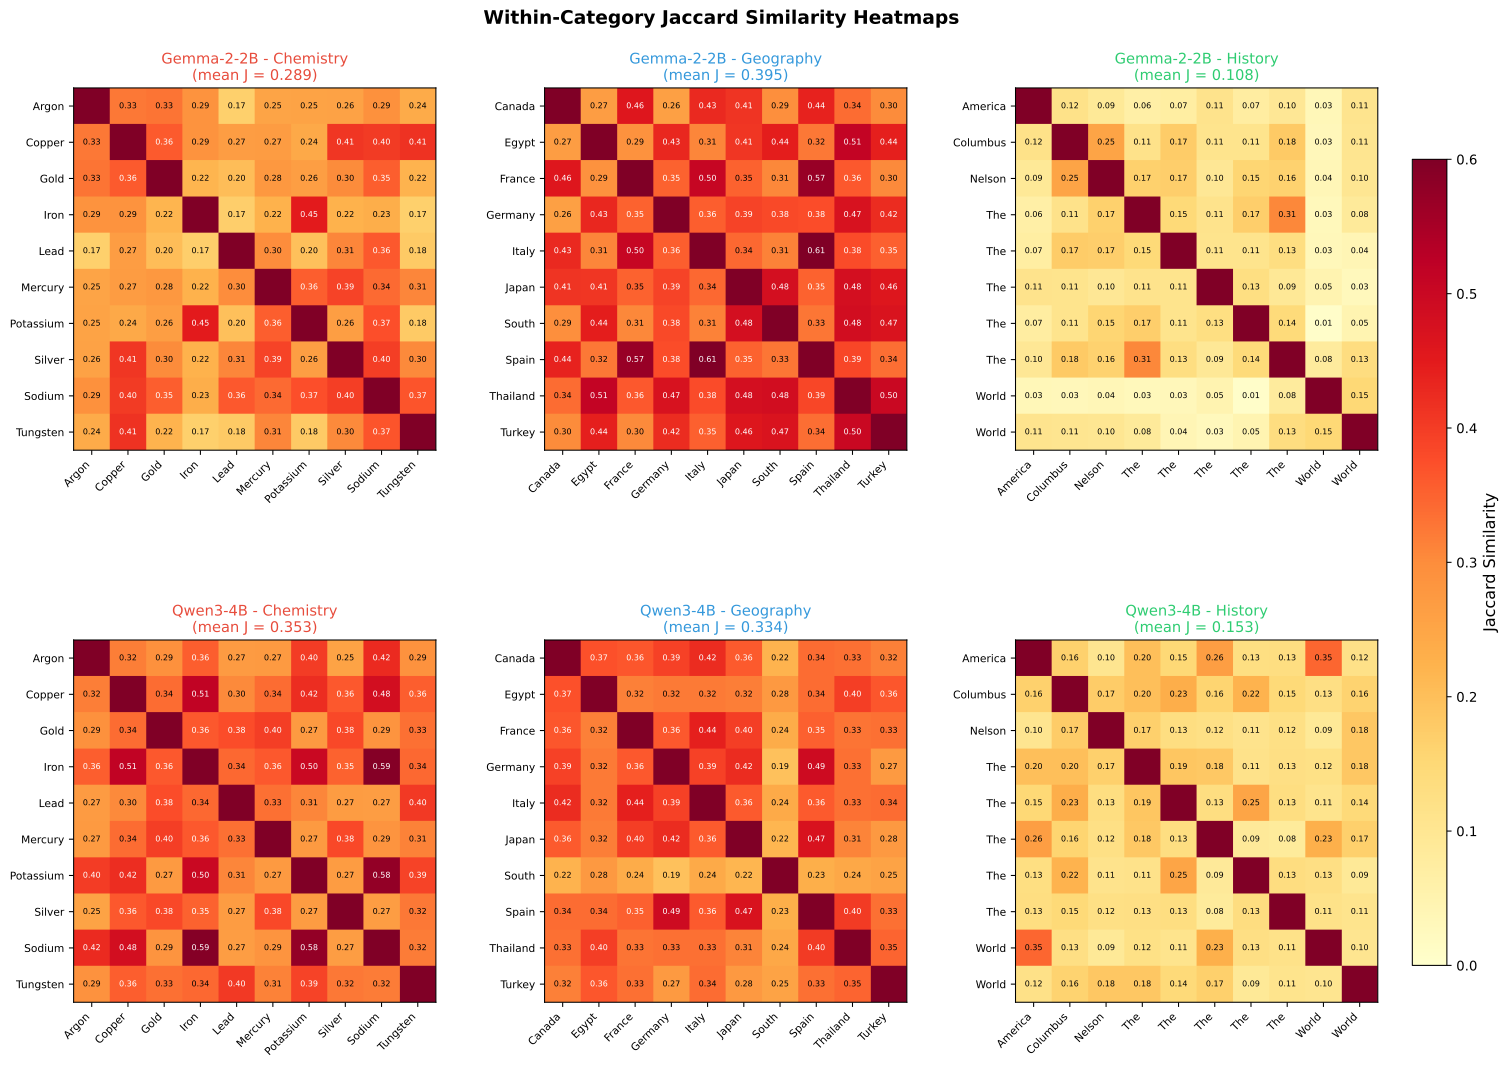
Within-category circuit similarity, measured as average pairwise Jaccard similarity of traceback path features, varies systematically by domain:

CategoryGemma JaccardQwen Jaccard
Chemistry0.2890.353
Geography0.3950.335
History0.1080.153

Geography is most conserved; history is most diverse. This is expected, since "WWII ended" and "Columbus reached the Americas" involve fundamentally different subject matter, while capital queries are structurally identical.
Jaccard similarity heatmaps

Figure 2. Within-domain circuits share more features than cross-domain. Pairwise Jaccard similarity between circuits within each knowledge domain, computed on bottleneck feature sets. Geography shows the strongest convergence (J = 0.40); history the weakest (0.11). Heatmaps for Gemma (top) and Qwen (bottom) across chemistry, geography, and history.

3.2 Architecture dominance

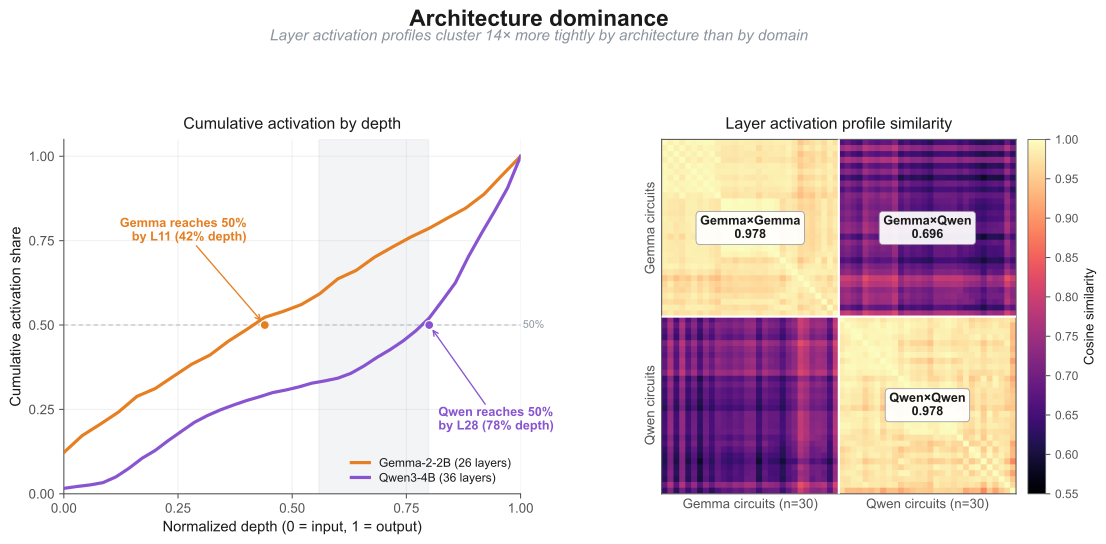
We computed cosine similarity between per-layer activation share profiles (summed activation magnitude at each layer as a proportion of the circuit total) for all pairs of circuits. Within-model similarity averages 0.978 (std = 0.013) across all 30 circuits within each model; profiles cluster tightly within each architecture regardless of knowledge domain. After normalizing both models to a common [0,1] depth scale, between-model similarity drops to 0.696 (std = 0.045; Mann–Whitney p < 1e-6). The gap of 0.282 is an order of magnitude larger than the within-model domain effect (~0.02).

Architecture explains ~14× more variance in layer activation profiles than knowledge domain. Within-category similarity is slightly higher than cross-category (Gemma: 0.984 vs 0.966; Qwen: 0.975 vs 0.956), confirming a small but statistically significant domain effect, but the architecture effect dwarfs it.
Architecture dominance: two-panel annotated hero figure

Figure 3. Architecture dominance. Left: Cumulative layer activation profiles show Gemma front-loads 54% of activation into the first half of layers while Qwen back-loads with only 31%: fundamentally different computational strategies, comparable factual recall. Right: Layer activation profile cosine similarity matrix across all 60 circuits. Within-model pairs (Gemma×Gemma and Qwen×Qwen) cluster at 0.978; between-model pairs (Gemma×Qwen off-diagonal blocks) drop to 0.696. Architecture explains ~14× more variance than knowledge domain.

Front-loading vs back-loading

The two models adopt fundamentally different activation accumulation strategies:

  • Gemma is front-loaded: 54% of total activation magnitude in the first half of layers (L0–L12). The cumulative share reaches 50% by L11 and 90% by L24.
  • Qwen is back-loaded: only 31% of the total in the first half (L0–L17). The cumulative share reaches 50% by L28 and 90% by L34.

These accumulation profiles are consistent across all three knowledge domains: category differences in the 50% threshold layer are only 1–2 layers within each model. Both strategies produce comparable factual recall accuracy: distinct but equally viable solutions to the same retrieval problem.
Where the bottleneck lives: per-layer bottleneck feature density by model
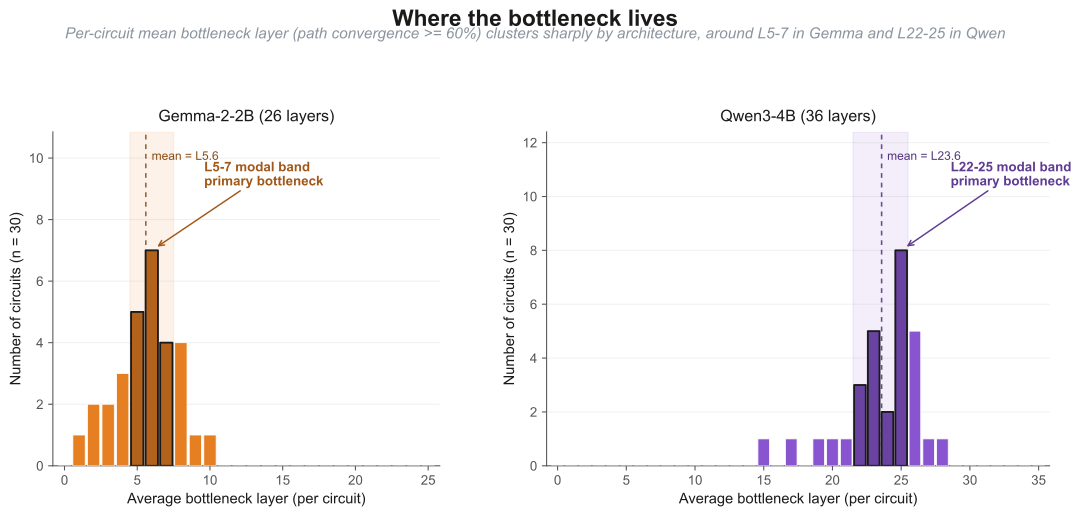
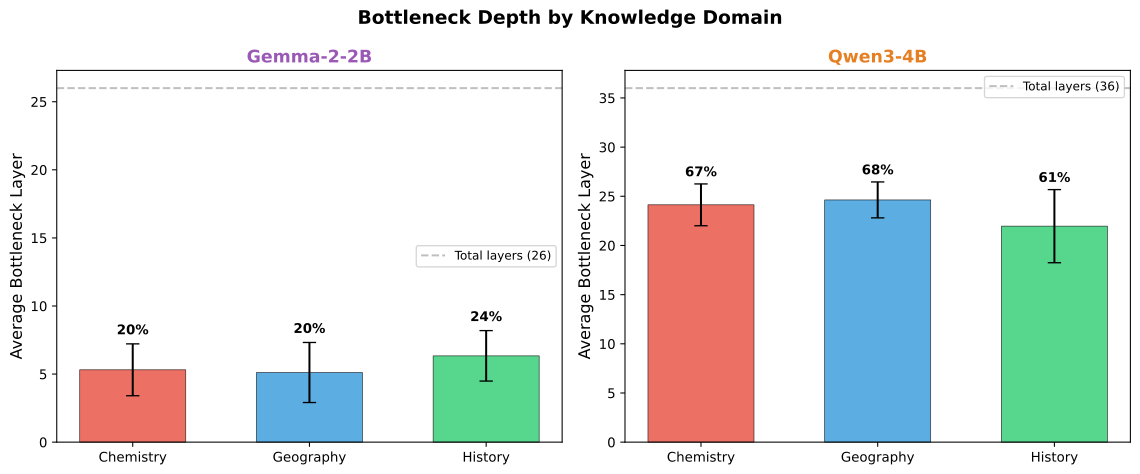
Figure 4. Where the bottleneck lives. Per-circuit mean bottleneck layer (path convergence ≥ 60%) across 30 Gemma circuits (left) and 30 Qwen circuits (right). Gemma circuits cluster at L5–7 (53% of circuits, mean L5.6); Qwen circuits cluster at L22–25 (60% of circuits, mean L23.6). The modal band in each histogram defines that model's primary bottleneck layer.

Bottleneck depth is architecture-dependent

Bottleneck layer position is determined by model architecture, not knowledge domain:

CategoryGemma Avg Layer% DepthQwen Avg Layer% Depth
ChemistryL5.521%L24.167%
GeographyL5.822%L24.668%
HistoryL6.625%L22.061%

Gemma bottlenecks consistently cluster in layers 5–7 (~22% depth) across all three domains; Qwen bottlenecks cluster in layers 22–25 (~65% depth). Within-model variation across domains is much smaller than between-model variation.
Bottleneck depth distribution

Figure 5. Bottleneck depth is architecturally determined. Across all three knowledge domains, Gemma bottlenecks sit at L5–7 (about 22% depth); Qwen bottlenecks at L22–25 (about 65%). Domain modulates the depth by less than 2 layers.


3.3 Universal bottlenecks

We identified features that serve as bottlenecks across all three knowledge domains. Zero features are shared between Gemma and Qwen, further supporting the architecture-dominance hypothesis.

Gemma Universal Bottlenecks (6)

FeatureLayerDescription
L0_F1813559L0Code/file keywords
L0_F74438300L0
L3_F5150441L3HTML formatting tags
L4_F110446948L4Place names
L6_F2586668L6Code snippets
L24_F88478228L24Lithuanian place names

Qwen Universal Bottlenecks (15)

FeatureLayer
L15_F8173514424L15
L16_F1043399704L16
L17_F6197796762L17
L18_F11703352509L18
L19_F6611637508L19
L24_F457788386L24
L25_F942235729L25
L26_F10368215974L26
L27_F12610705050L27
L28_F393078712L28
L29_F89625936L29
L32_F3158177517L32
L33_F10240593794L33
L34_F415944868L34
… (15 total)L15–L34

Qwen has 2.5× more universal bottlenecks than Gemma (15 vs 6), and they span a wider layer range (L15–L34 vs L0–L24). This is consistent with Qwen's later, more distributed bottleneck architecture providing more opportunities for cross-domain feature sharing. The notable descriptions of Gemma's universal features ("HTML formatting tags," "code/file keywords," "place names") are structural/format features, not factual knowledge stores. They function as architecture-specific routing infrastructure.

Top bottleneck consistency. L34_F415944868 appears as a bottleneck in 100% of Qwen geography, 100% of Qwen history, and 90% of Qwen chemistry circuits, a domain-agnostic late-layer hub.


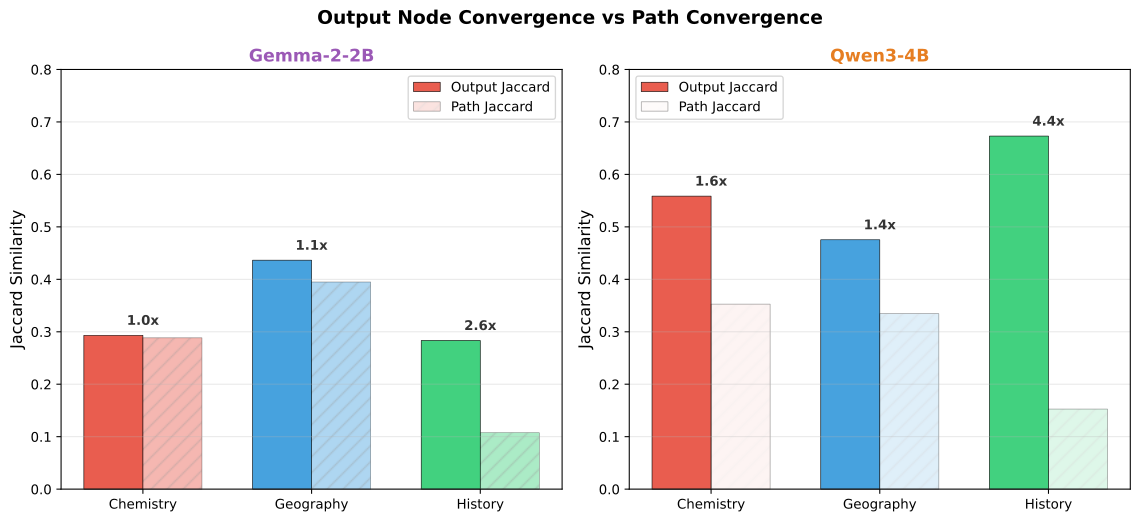
3.4 Output convergence vs path divergence

We separately analyzed whether same-domain circuits converge at the output layer (final-layer features) versus along full traceback paths.

ModelCategoryOutput JaccardPath JaccardRatio
GemmaChemistry0.2930.2891.02
GemmaGeography0.4360.3951.10
GemmaHistory0.2830.1082.63
QwenChemistry0.5590.3531.58
QwenGeography0.4750.3351.42
QwenHistory0.6730.1534.41

Output node convergence is consistently higher than path convergence, and the gap is largest for history (4.41× in Qwen). History circuits share the same output features (the model uses similar features to produce the final prediction) even though their intermediate processing paths diverge substantially. The model arrives at a similar "output vocabulary" through different internal routes.
Output vs path convergence

Figure 6. Convergent outputs from divergent paths. Same-domain circuits share output features at up to 4.4× the rate of path-feature overlap (history in Qwen), confirming that different internal routes produce shared output vocabulary. Bar pairs compare output Jaccard (left) and path Jaccard (right) by domain for each model.

This has implications for model editing: intervening at the output layer would affect most circuits within a domain, while intervening at intermediate layers requires more domain-specific targeting.


3.5 The bottleneck penalty

We correlated each layer's activation share with output probability across all 30 circuits within each model, applying Bonferroni correction (Gemma: α = 0.0019 for 26 tests; Qwen: α = 0.0014 for 36 tests).

LayerSpearman rp-valueDirection
L6 (bottleneck)−0.684<0.0001Negative (bottleneck penalty)
L10−0.6010.0004Negative
L1+0.6340.0002Positive
L13+0.6010.0004Positive
L16+0.5980.0005Positive

L6, the primary bottleneck layer, shows the strongest negative correlation (r = −0.684). Circuits with a larger fraction of activation magnitude at the bottleneck layer exhibit lower output confidence. Activation at post-bottleneck layers (L13, L16) positively predicts confidence. We term this pattern the "bottleneck penalty."

Bottleneck penalty: two-panel annotated hero figure

Figure 7. The bottleneck penalty. Per-layer Spearman correlation between activation magnitude fraction and output confidence across 30 Gemma circuits. Bottleneck layer L6 shows a strong negative correlation (r = −0.684, p < 0.0001): circuits concentrating more activation at L6 produce less confident predictions. Post-bottleneck layers L13, L16 reverse the sign (r ≈ +0.60), consistent with information bottleneck framing: heavier compression at intermediate layers reduces information available for downstream evidence accumulation.

Theoretical framing: information bottleneck theory

We interpret this pattern through information bottleneck theory (Tishby & Zaslavsky, 2015; Shwartz-Ziv & Tishby, 2017), which formalizes the tradeoff between representational compression and predictive accuracy. Each layer L computes a representation TL of the input X with mutual information I(X; TL); heavier compression at an intermediate layer reduces what downstream layers can recover. Our correlation is consistent with this prediction: circuits that concentrate more activation magnitude at L6 may be compressing input representations more aggressively, leaving less information for evidence accumulation at L13–L16. Activation at post-bottleneck layers positively predicts confidence, consistent with those layers aggregating information into the final decision.

Important caveat

Activation magnitudes at different layers are computed independently; no conserved quantity is being allocated across layers. The bottleneck penalty is a correlation, not a mechanistic causal claim. Alternative explanations include prompt-difficulty confounds, domain-specific accuracy differences, and feature-selection effects in the traceback algorithm. Direct interventional validation (clamping L6 activation and measuring confidence change) would require local model access not currently available through the Neuronpedia API.

Qwen shows 0 Bonferroni-significant layers (best: L29, r = 0.552, p = 0.0016), consistent with its late-layer architecture decoupling layer-level activation from confidence.


3.6 Circuit redundancy

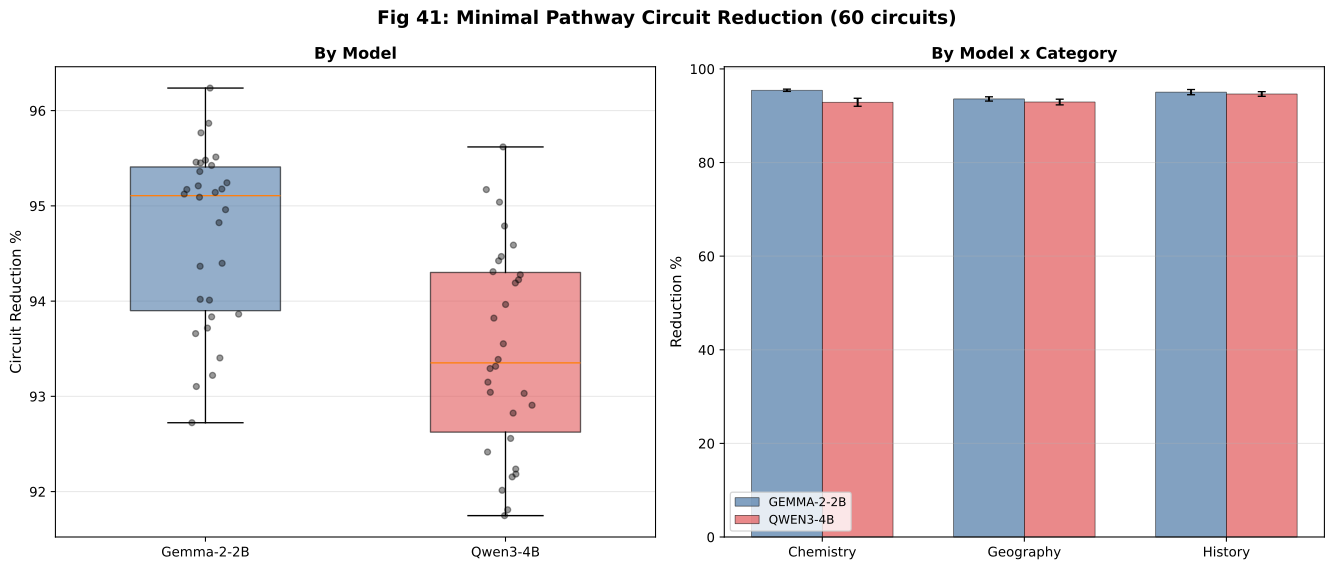
We extracted the minimum viable circuit connecting input features (early layers, high fan-out) to output features (late layers, high fan-in) for all 60 circuits.

94.1% redundant
Mean reduction across 60 circuits is 94.1% (±1.2%). Only ~6% of nodes participate in shortest input-to-output pathways. Consistent across models and categories.
Single-node bottlenecks
Mean minimal-pathway bottleneck width is 1.1 features. Nearly every circuit funnels through a single critical node in its essential pathway.
0.3% essential weight
Minimal pathway retains just 0.3% of total edge weight. Most edge weight flows through redundant, non-essential connections.
Redundancy → confidence
Gemma: r = 0.642 (p<0.001). More redundant circuits → more confident outputs. Qwen: r = -0.051 (no relationship).
Minimal pathway extraction

Figure 8. Circuits are 94% redundant. Minimal pathway extraction prunes circuits until only essential edges remain: essential edges carry just 0.3% of total weight, yet preserve output behavior. Gemma essential-pathway bottlenecks concentrate at L22 (median); Qwen at L30.

The Gemma redundancy–confidence correlation suggests a functional role: more redundant circuits may represent more robust, well-established factual memories where the model has encoded multiple parallel pathways to the same answer. This "redundancy-as-robustness" hypothesis aligns with the ensemble interpretation of neural network computation.


3.7 Causal steering: three-tier dissociation

Across 80 steering experiments on Gemma, we tested whether structural importance metrics on the attribution graph predict behavioral causal influence. Three categories of features were tested: original 5 bottleneck features (Section 6a), 5 cross-circuit-frequency-selected features (Section 6b), and 5 essential-pathway features (Section 6c).

3.7a Initial steering (20 experiments)

Mean logprob shift = 0.045 across all experiments; 50% produced visible text changes. Effects are probability-level perturbations rather than token-flipping interventions. Critical methodological finding: none of the 5 steered features appeared as nodes in their respective circuits' attribution graphs. The threshold-based circuit extraction filters out features that exert causal influence below the display threshold. This visibility gap means circuit-based analysis underestimates the set of causally relevant features.

3.7b Frequency vs causation (D5, 30 experiments)

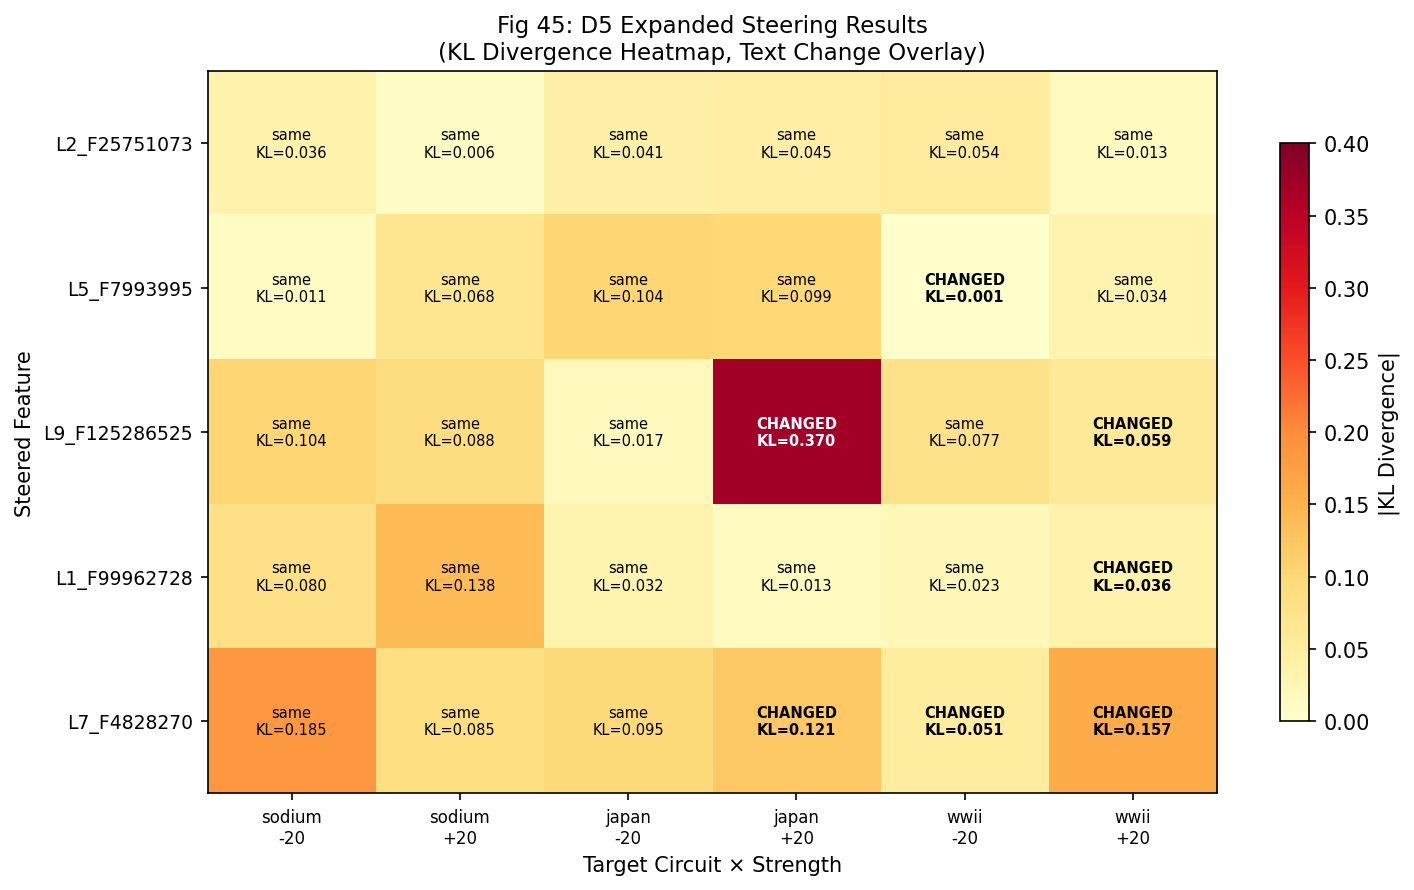
We expanded by testing 5 high-frequency cross-circuit features (each appearing in 9–11 of the 30 Gemma circuits) on 3 target circuits at strengths ±20.

  • 23.3% text change rate for D5 features vs 50% for the original set. Cross-circuit frequency alone is insufficient for predicting causal effectiveness.
  • L2_F25751073, the feature appearing in the most circuits (11), produced zero text changes when steered.
  • L7_F4828270 (9 circuits) was the most effective new feature (3/6 changed). High frequency does not imply high causal influence.
D5 steering heatmap

Figure 9. Frequency does not predict causal influence. Expanded D5 steering batch: high-frequency cross-circuit features are not preferentially steerable, and domain susceptibility runs history > geography > chemistry rather than tracking topological centrality. Each point is one of 60 steering trials, color-coded by knowledge domain.

3.7c Essential-pathway steering (30 experiments)

From the 1,000 unique features identified on essential pathways across 30 Gemma circuits, we selected 5 high-frequency essential-pathway features not previously tested.

  • 26.7% text change rate, comparable to D5 features off essential pathways (33.3%) and intermediate to D5 features on essential pathways (18.8%).
  • Essential-pathway features produce substantially larger distributional perturbations: mean KL divergence = 1.448, vs much lower for D5 features. The strongest single perturbation (L25_F50014975 amplification on geography, KL = 12.72) changed the output from a generic description to the factually correct "Tokyo," suggesting the feature gates factual recall at the output layer.
  • Layer depth modulates direction: early pathway features (L0, L1) produced changes exclusively via suppression; late features (L21, L24, L25) responded to both directions.
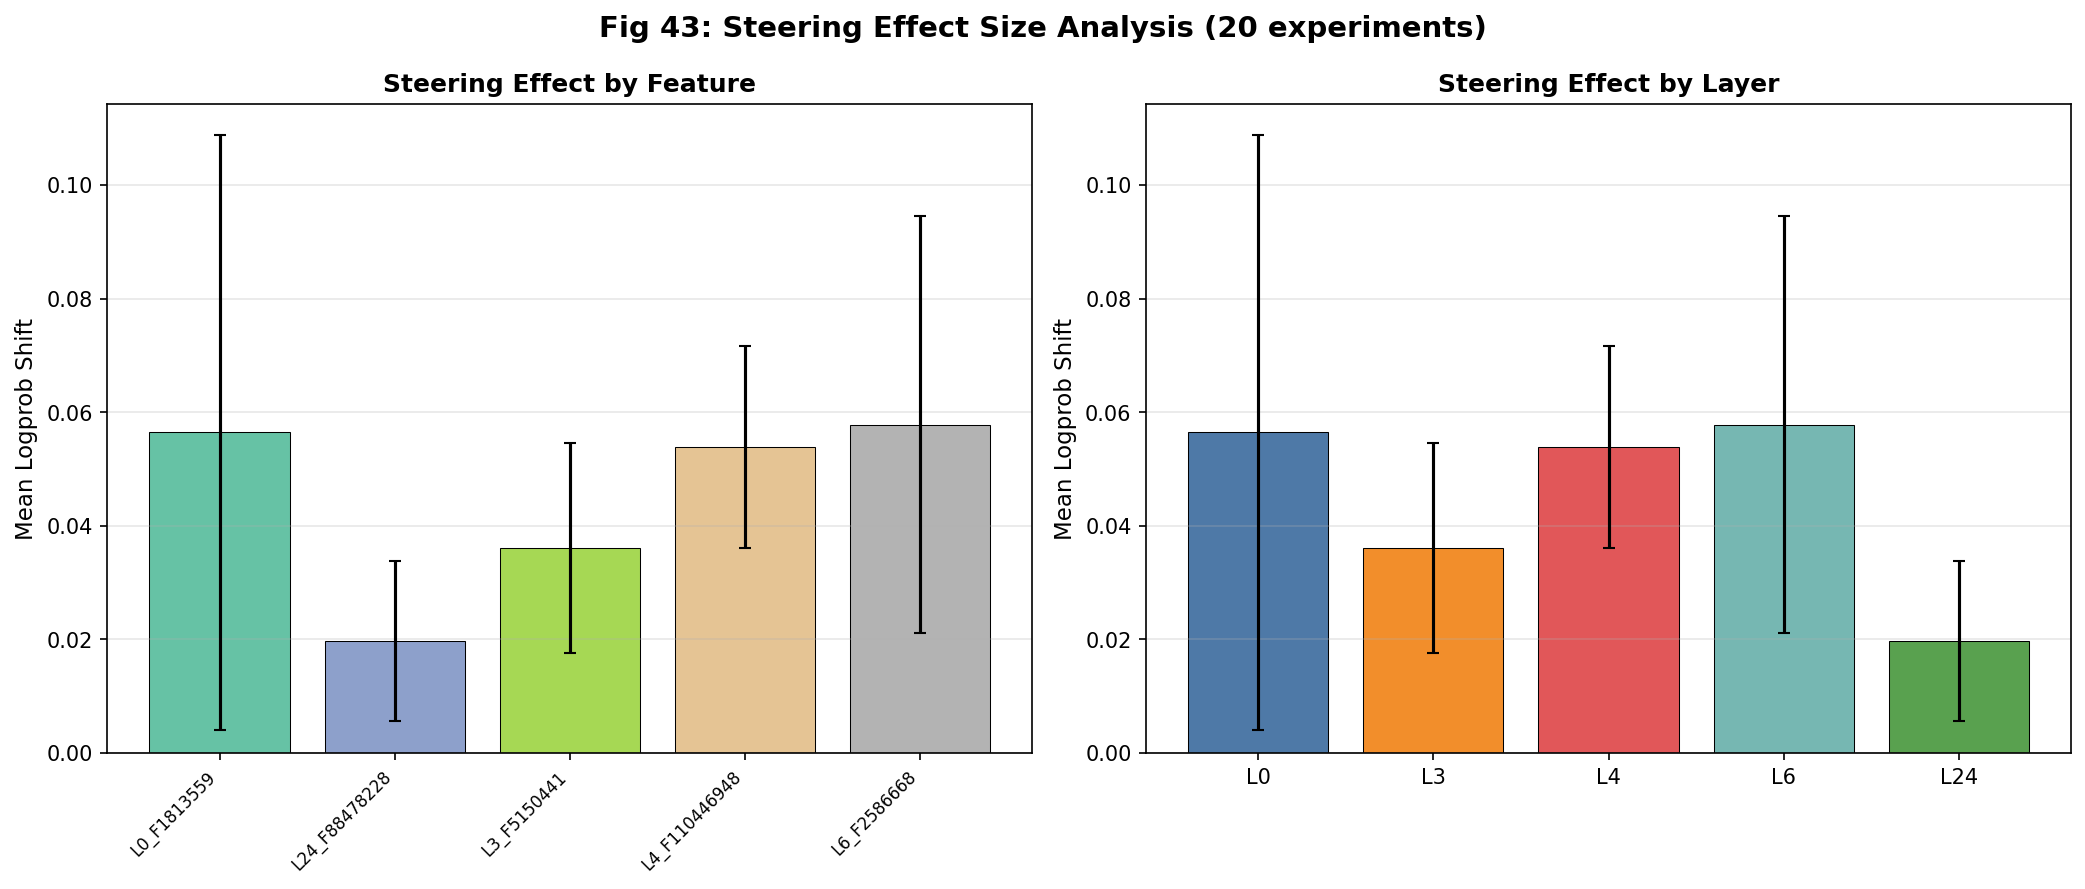
Steering effects across experiments

Figure 10. Half of steering interventions produce visible text changes. Initial 20 steering experiments: mean logprob shift = 0.045, and 50% of trials flip the argmax output token. Distributional perturbation strength does not cleanly predict which trials yield surface-level text changes.

Domain susceptibility

Steering susceptibility is highly asymmetric across domains and replicates across all three experiment sets:

Chemistry
0%
0/30
Geography
20%
2/10
History
60%
6/10

Chemistry circuits produce the most deterministic outputs (Na, Fe, Pb are near-certain completions), making them resistant to perturbation. History and geography outputs have more distributional uncertainty, creating room for steering to shift the argmax.

The Three-Tier Dissociation. Combining all 80 experiments yields a three-tier model of feature importance: (1) features on essential pathways perturb probability distributions most strongly (highest KL); (2) features with high cross-circuit frequency are statistically common but not necessarily causal; (3) text-level output changes are governed primarily by output entropy and domain determinism rather than by any single feature-selection criterion. Topology, frequency, and text-level effects decouple.

The three-tier dissociation schematic Three stacked tiers showing three independent dimensions of feature importance: essential-pathway topology (Tier 1), cross-circuit frequency (Tier 2), and output determinism by domain (Tier 3). Tier 1 · Essential-pathway topology Governs distributional perturbation strength · mean KL = 1.448 Example: L25_F50014975 amplification → KL = 12.72 (“Tokyo”) decoupled Tier 2 · Cross-circuit frequency Statistically common · causally weak · does NOT predict steering effect Example: L2_F25751073 (highest frequency, 11 circuits) → 0% text changes decoupled Tier 3 · Output determinism by domain Governs text-level susceptibility · chemistry 0% · geography 20% · history 60% Attribution graphs do NOT capture this tier
Figure 11. Three independent tiers of feature importance, none predictive of behavior alone. Tier 1 (essential-pathway topology) governs distributional perturbation strength. Tier 2 (cross-circuit frequency) is statistically common but causally weak. Tier 3 (output determinism by domain) governs text-level susceptibility (chemistry 0%, geography 20%, history 60%). Attribution graphs capture Tier 1 but not Tier 3.

3.8 Format variation: template > fact > cross-domain

A critical question is whether the within-domain circuit similarity reflects genuine knowledge-domain convergence or merely prompt-template similarity (all chemistry prompts share "The chemical symbol for X is"). To test this, we generated circuits for the same fact (gold) using three different prompt formats.

ComparisonMean JaccardN pairs
Same fact, different format (gold × 3)0.3063
Different fact, same format (chemistry)0.6113
Different fact, same format (geography)0.7133
Different fact, same format (history)0.1563
Different fact, same format (all domains)0.4939
Cross-domain baseline0.11227

Prompt template drives 1.6× more circuit overlap than factual identity, but the effect is domain-dependent. Chemistry (0.611) and geography (0.713) show strong template-driven convergence, but history (0.156) does not. History circuits are so structurally diverse that the template provides little convergence beyond the cross-domain baseline (0.112). Hierarchy: template > fact > cross-domain for chemistry/geography, but fact > template ≈ cross-domain for history.

Same-fact-different-format Jaccard (0.306) is still 2.7× higher than the cross-domain baseline (0.112), confirming that knowledge domain contributes to circuit structure beyond template effects alone.

This finding does not undermine the architecture-dominance result, which is based on per-layer activation profiles (cosine similarity 0.978 within-model), not feature-level Jaccard. Layer activation profiles are robust to prompt format because they capture the distribution of computation across layers, not the identity of individual features. The format effect operates at the feature-selection level (which specific features are activated) while the architecture effect operates at the computational-structure level (where activation is concentrated).


4. Discussion

4.1 Architecture vs domain

Beyond bottleneck position, the entire layer-by-layer activation distribution is architecture-determined. Gemma routes all factual knowledge through early-layer bottlenecks (L5–7); Qwen routes through late-layer bottlenecks (L22–25). Within-model cosine similarity is 0.978 (profiles cluster tightly across domains) while between-model similarity drops to 0.696 even after depth normalization. The architecture gap is approximately 14× the domain gap.

Edge flow analysis extends this invariance from activation magnitude to wiring topology. Cross-category edge pattern similarity is 0.995 for both models, higher than the 0.978 layer activation profile similarity. Domains share nearly identical wiring diagrams within each architecture. Skip connections dominate: 80–85% of edges bypass adjacent layers.

The complementary accumulation strategies, with Gemma placing 54% of total activation magnitude in the first half of layers while Qwen places only 31%, reflect different depth strategies. In Gemma activation concentrates early and falls off toward the output; in Qwen it accumulates broadly before concentrating in late layers. Both strategies produce comparable factual recall accuracy across all three domains, demonstrating that early-bottleneck and late-bottleneck architectures represent distinct but equally viable solutions to the same knowledge retrieval problem.

4.2 Universal features as routing infrastructure

The existence of universal bottleneck features that participate in all three knowledge domains suggests these features serve as general-purpose routing or gating infrastructure rather than domain-specific knowledge stores. A feature that activates for chemistry, geography, AND history queries is unlikely to encode any specific factual content; instead, it may implement a more general function such as attention routing, information filtering, or output formatting.

The notable descriptions of Gemma's universal features support this interpretation: "HTML formatting tags," "code/file keywords," and "place names" are structural/format-related features, not factual knowledge features. Co-activation analysis further reveals that these universal features organize into within-layer functional modules: same-layer co-activation is 1.9× stronger than cross-layer, and hierarchical clustering identifies 5 distinct feature groups. This modular organization suggests a structured routing infrastructure rather than a random collection of individually useful features.

Polysemanticity analysis provides additional converging evidence. CODE (20%) and LANGUAGE (20%) features, encoding formatting, syntax, and linguistic patterns, outnumber domain-specific features (13%). 54% of features appear in ≥2 domains and 18% in all 3. The low overall polysemanticity rate (12.3%) suggests bottleneck features are more specialized than the average transcoder feature: they are selected by the circuit architecture for specific routing functions, even when those functions span multiple knowledge domains.

4.3 Bottleneck penalty interpretation

Per-layer analysis reveals that Gemma L6 (the primary bottleneck layer) shows a strong negative correlation with confidence (r = −0.684, p < 0.0001), while activation at post-bottleneck layers (L13: r = +0.601; L16: r = +0.598) positively predicts confidence. We term this pattern the "bottleneck penalty": heavier bottleneck-layer activation is associated with lower downstream confidence.

We interpret this pattern through information bottleneck theory (Tishby & Zaslavsky, 2015; Shwartz-Ziv & Tishby, 2017). The theory formalizes the tradeoff between compression and prediction in deep networks: each layer L computes a representation TL of the input X with mutual information I(X; TL), and heavier compression at an intermediate layer reduces the information available to downstream layers for reconstruction and prediction. Our observation (more bottleneck-layer activation predicts worse confidence) is consistent with the prediction that over-compression at L6 limits the information downstream layers (L13, L16) can use for evidence accumulation. We emphasize "consistent with" rather than "proof of": our measurements are of activation magnitude, not mutual information, and our analysis is correlational, not interventional.

A nuance from output decomposition. While the bottleneck penalty operates at the circuit level (more overall bottleneck weight = lower confidence), the critical paths show the opposite pattern: paths that route more through bottleneck layers yield higher confidence (r = 0.415, p = 0.016). Bottleneck layers are simultaneously the most important processing hubs and the most costly when over-used. This dual role, essential routing infrastructure that imposes compression costs when overloaded, is consistent with the information bottleneck framework.

Qwen shows no per-layer confidence relationships (0 Bonferroni-significant layers), consistent with its late-layer architecture diffusing confidence signals across many layers. The information bottleneck framework predicts that architectures with diffuse compression should exhibit weaker per-layer correlations with output quality, which is what we observe.

4.4 Three-tier dissociation

Minimal pathway analysis reveals that circuits are 94.1% redundant: only ~6% of nodes participate in the essential input-to-output pathways, and these pathways carry just 0.3% of total edge weight. Gemma's redundancy positively correlates with confidence (r = 0.642), suggesting a functional role for this redundancy. More redundant circuits may represent more robust, well-established factual memories where the model has encoded multiple parallel pathways to the same answer.

Our steering analysis reveals a critical methodological gap: features that exert causal influence through steering are invisible in the attribution graph. None of the 5 initially steered features appeared as nodes in their circuits' graphs. This "visibility gap" means that circuit-based analysis underestimates the causally relevant feature set: the attribution graph captures only above-threshold activations, while causal influence extends to sub-threshold features.

The essential-pathway steering validation reveals a three-tier dissociation between structural importance metrics and causal influence. Features on the minimal viable pathway produce the strongest distributional perturbations (mean KL = 1.448), but neither pathway position (26.7% text change rate) nor cross-circuit frequency (23.3% for frequency-selected features) reliably predicts text-level output changes. This dissociation suggests that the attribution graph captures two distinct types of information: (1) the essential routing topology, which determines how strongly a feature can perturb probability distributions, and (2) the redundancy structure, which determines whether that perturbation survives to change the argmax output token.

Features on essential pathways are genuinely important for information flow (their perturbations propagate strongly through the circuit), but the model's 94.1% circuit redundancy provides compensatory pathways that absorb these perturbations before the output layer. The domain asymmetry in steering susceptibility (history > geography > chemistry = 0) has a natural interpretation: chemistry circuits produce the most deterministic outputs (Na, Fe, Pb are near-certain completions), making them resistant to perturbation; history and geography outputs have more distributional uncertainty, creating more room for steering to shift the argmax.


5. Limitations

  1. Two models only. Findings based on Gemma-2-2B and Qwen3-4B. Larger models or instruction-tuned variants may exhibit different patterns.
  2. Sample size. n = 30 per model; correlations below |r| = 0.45 are unreliable at α = 0.05; only |r| ≥ 0.60 survives Bonferroni correction.
  3. Transcoder quality & Qwen annotation gap. 114 of 244 cross-circuit features (all Qwen) lack Neuronpedia explanations, limiting polysemanticity analysis to Gemma.
  4. Prompt format effects. Within-domain Jaccard is partially inflated by template similarity for chemistry/geography (Section 7). Architecture-dominance result is robust to this confound.
  5. Correlational, not interventional. The bottleneck penalty is correlational; direct clamping of L6 activation requires local model access not available via Neuronpedia API.
  6. Limited steering coverage. 80 experiments on Gemma only (Qwen transcoder steering not yet supported); ±20 strength only; 15 features total.
  7. Community degeneracy. 4-method validation shows high modularity but low cross-algorithm agreement (mean Jaccard = 0.363). Community boundaries are algorithm-dependent.
  8. Visibility gap. Steered features are causally relevant but invisible in the circuit representation, suggesting threshold-based extraction systematically underestimates the causally relevant feature set.

6. Conclusions

Factual knowledge retrieval in large language models is constrained by architectural processing strategy across the full layer-by-layer activation profile. The bottleneck penalty provides a mechanistic link between structure and behavior: confident predictions arise from evidence accumulation beyond the bottleneck, not from compression quality. The three-tier causal dissociation, where topology, frequency, and text-level effects decouple, reveals that attribution graphs capture only a fraction of causally relevant computation, mediated by layers of circuit redundancy.

Future Work

  • Extend to more models and domains
  • Expand steering with dose-response curves and more circuits
  • Develop sub-threshold circuit extraction to address the visibility gap
  • Test varied prompt formats to disentangle format from domain effects
  • Annotate remaining Qwen features when API support becomes available
  • Build predictive models combining structural and causal metrics

Supplementary Materials

Full Paper PDF

Complete paper with all 21 supplementary sections, statistical appendices, and figure pack.

Download PDF

Code & Data

Full pipeline source code, attribution graph data, traceback algorithm, and analysis notebooks:

GitHub Repository

Live Attribution Graphs

Interactive Neuronpedia attribution graph viewer:


References

  1. Bricken, T., et al. (2023). Towards Monosemanticity: Decomposing Language Models With Dictionary Learning. Anthropic.
  2. Cunningham, H., et al. (2024). Sparse Autoencoders Find Highly Interpretable Features in Language Models. ICLR 2024.
  3. Elhage, N., et al. (2021). A Mathematical Framework for Transformer Circuits. Anthropic.
  4. Meng, K., et al. (2022). Locating and Editing Factual Associations in GPT. NeurIPS 2022.
  5. Neuronpedia. Decode Research. https://neuronpedia.org
  6. Olah, C., et al. (2020). Zoom In: An Introduction to Circuits. Distill.
  7. Templeton, A., et al. (2024). Scaling Monosemanticity: Extracting Interpretable Features from Claude 3 Sonnet. Anthropic.
  8. Shwartz-Ziv, R., & Tishby, N. (2017). Opening the Black Box of Deep Neural Networks via Information. arXiv:1703.00810.
  9. Tishby, N., & Zaslavsky, N. (2015). Deep Learning and the Information Bottleneck Principle. IEEE Information Theory Workshop (ITW).
  10. Turner, A., et al. (2023). Steering Language Models With Activation Engineering. arXiv:2308.10248.
  11. Wang, K., et al. (2023). Interpretability in the Wild: A Circuit for Indirect Object Identification in GPT-2 Small. ICLR 2023.

BibTeX

@article{lawrence2026crossdomain,
  title   = {Cross-Domain Circuit Analysis of Factual Knowledge Retrieval
             in Large Language Models},
  author  = {Lawrence, Joseph and Krampis, Konstantinos},
  year    = {2026},
  month   = {April},
  note    = {60 attribution graphs across {Gemma-2-2B} and {Qwen3-4B};
             traceback graphing, bottleneck penalty, three-tier causal dissociation},
  url     = {https://github.com/J-Lawrence10/autocircuit}
}